The 4 Social Media Metrics That Actually Matter
Stop obsessing over raw likes and follower counts. Here's what to track instead — and what to do the moment those numbers shift.
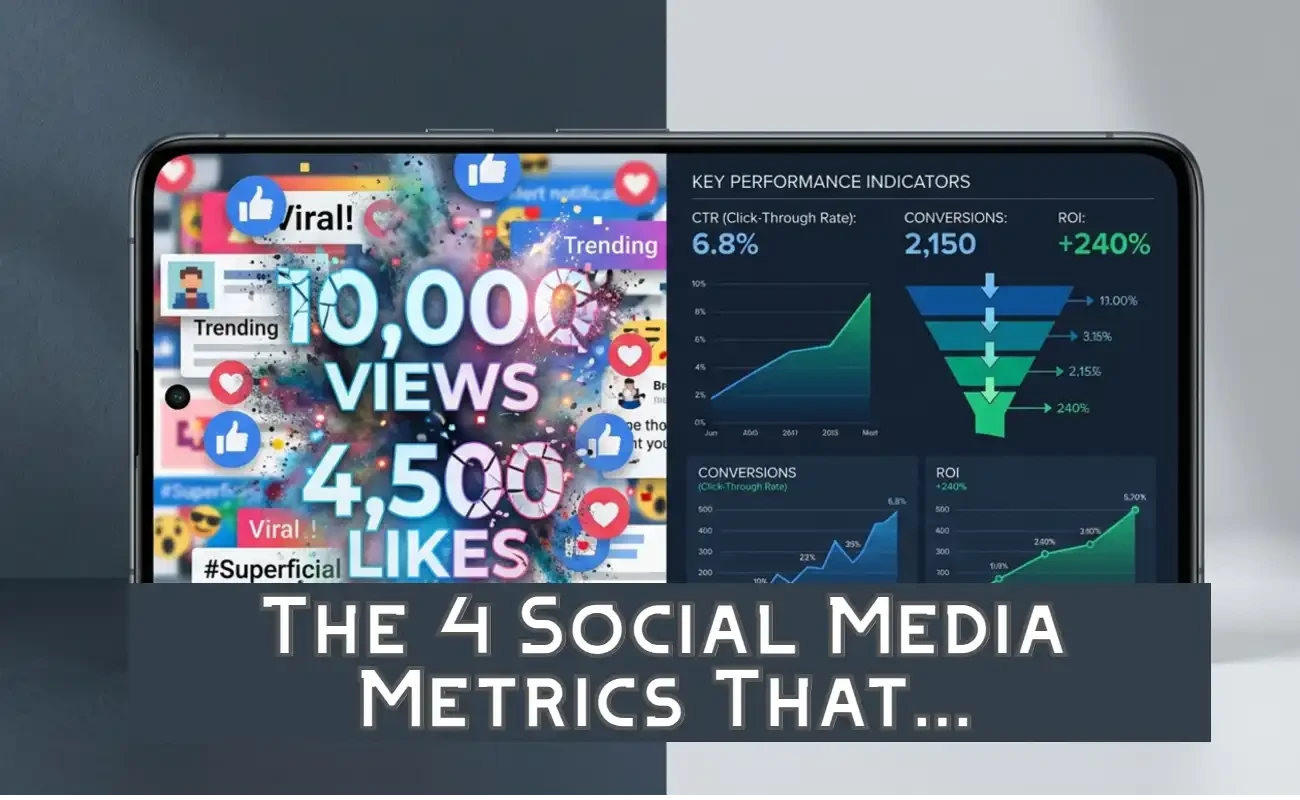
You've been refreshing your dashboard all day, watching the likes roll in. Your latest post hit 10,000 impressions. Your follower count ticked up by thirty. And yet — your sales haven't moved. Your inbox is quiet. Your lead gen form might as well be a digital ghost town.
If that sounds familiar, you're not alone. Most social media managers are drowning in numbers that feel important but say almost nothing about whether their strategy is actually working. The platforms hand you vanity metrics on a silver platter because those numbers keep you engaged — on their platform. But your business doesn't run on impressions. It runs on revenue, relationships, and results.
Here's the truth: there are exactly four categories of metrics that determine whether your social media strategy is working. Most marketers are actively tracking one, passively aware of another, and completely ignoring the other two. That's a problem — but it's also an opportunity.
By the end of this post, you'll know not just what to track, but what to do the moment those numbers shift.
TL;DR: Stop obsessing over raw likes and follower counts. The four metrics that actually matter are: Engagement Rate (quality of interaction), Click-Through Rate (bridge to your funnel), Audience Growth Rate (velocity of growth, not volume), and Conversion Rate from Social (actual business impact). Track these in real time, and act immediately when they move.
The Problem With Vanity Metrics
Let's be honest: vanity metrics feel good. There's a small dopamine hit every time you see a post crack five figures in impressions or your follower count rolls over a nice round number. But feeling good and performing well are not the same thing.
Vanity metrics — impressions, total reach, raw likes, follower count — are seductive because they're visible. They're the first numbers platforms show you, often in large, friendly fonts. But visibility doesn't equal value. A post with 50,000 impressions and zero clicks is objectively worse than one with 2,000 impressions and 300 clicks. The first post made noise. The second made progress.
The deeper issue is that these metrics don't correlate to revenue or audience quality. You can buy followers. You can boost impressions. You can rack up likes from bots or passive scrollers who will never remember your brand, let alone buy from it. Platforms are designed to surface these numbers because they keep you creating content — for the platform. Not for your business.
So what should you be watching instead? Here are the 4 metrics that actually tell you something.
The 4 Metrics That Actually Matter
1Engagement Rate
Total meaningful interactions divided by total reach or impressions, expressed as a percentage.
Raw engagement numbers are easy to game and hard to interpret. A post with 500 likes sounds impressive until you realize it reached 200,000 people. That's a 0.25% engagement rate — and that's abysmal.
Engagement rate tells you what percentage of people who saw your content cared enough to respond in a meaningful way. We're talking comments, shares, saves, and clicks — not passive thumbs-ups. According to Sprout Social's benchmark data, industry averages typically sit between 1–3% across major platforms. Anything above 5% is genuinely strong, and if you're consistently hitting 7–10%, you're in elite territory.
When it drops: Audit your last five posts immediately. Did you shift topics away from what your audience expects? Did you change posting times and miss your audience's active hours? Did you switch from video to static images, or vice versa, without testing first? Engagement rate is a diagnostic tool — a drop is your content telling you something changed, and not in a good way.
When it spikes: Double down now. Repurpose that content into a different format. Create a direct follow-up while the topic is hot. Pin it to your profile. Turn it into an ad. High engagement rate is proof you struck a nerve — don't let that insight go to waste.
2Click-Through Rate (CTR)
The percentage of people who clicked a link in your post out of everyone who saw it.
This is the bridge between social media and everything that happens on your website. If people aren't clicking, your funnel is broken before it even begins. It doesn't matter how beautiful your landing page is or how compelling your offer sounds if nobody makes it past the social post.
CTR is brutally honest. It strips away the comfort of high impressions and forces you to confront a simple question: did your content actually motivate anyone to take the next step?
When it drops: Start with your call-to-action. Is it vague? "Learn more" is a cop-out. "See the exact template we used to cut reporting time by 60%" is a reason to click. Next, check your link preview — does the image look broken, cropped weird, or untrustworthy? Finally, audit message match. If your post is about social media strategy but your link leads to a general marketing services page, you've created friction you can't afford.
When it's strong: Document everything. What was the content format? What was the CTA phrasing? What time did it post? What did the thumbnail look like? Strong CTR means you've found a pattern that converts attention into action. Your job is to replicate that pattern until the data tells you otherwise.
3Audience Growth Rate
Net new followers over a time period divided by your existing audience, expressed as a percentage.
Follower count is a snapshot. Audience growth rate is a story. One thousand new followers on a 500-person account is explosive 200% growth. One thousand new followers on a 500,000-person account is 0.2% stagnation. Raw count hides this truth, and hiding the truth is how you end up celebrating mediocrity.
Growth rate reveals whether your audience is compounding or flatlining. It accounts for churn, for seasonality, and for the reality that growth gets harder as you scale. A healthy growth rate means your content is finding new people faster than you're losing old ones.
When it stalls: Look backward. What content drove your last growth spike? Was it a collaboration, a viral post, a trending audio, or a specific hashtag strategy? If your posting frequency has dropped, that's usually the first culprit. If your frequency is steady, look at competitor activity — is there a conversation happening in your industry that you've gone silent on?
When it accelerates: Identify the trigger and engineer it intentionally. If a collaboration drove the spike, book another. If a specific post format went viral, build a content series around it. If a hashtag put you in front of a new audience, create three more pieces for that community. Acceleration is not luck — it's leverage.
4Conversion Rate from Social
The percentage of social visitors who completed a desired action: purchase, sign-up, download, or inquiry.
This is the only metric that directly ties social media to business outcomes. Everything else — engagement rate, CTR, growth rate — is upstream of this number. They matter because they feed into this one.
Conversion rate is where marketing meets math. It doesn't care how creative your post was or how many hours you spent on the graphic. It cares about one thing: did a person who found you on social media do the thing you wanted them to do?
When it drops: Check message match first. Does your landing page deliver on the promise your social post made? If you teased a "free ROI calculator" and the landing page asks for a credit card, you haven't just lost a conversion — you've damaged trust. Next, check mobile load times. Over 60% of social traffic is mobile, and every second of load time kills conversions. Finally, verify your UTM tracking. If your attribution is broken, you might be converting just fine and not knowing it.
When it's high: Scale immediately. Increase the budget on that campaign, extend its run dates, and use its messaging as a template for future creative. High conversion rate is proof that you've aligned audience, message, and offer. That's rare. Treat it like the asset it is.
"The gap between when your data is generated and when you act on it is where your competitors win."
The Real-Time Advantage: Why Lag Kills Strategy
Here's a scenario that plays out in marketing teams every single week: a campaign underperforms on Tuesday. Nobody notices until Friday's standup. They spend Monday in a spreadsheet trying to diagnose the problem. By Wednesday, they've made a decision. By Thursday, they've implemented a fix. The campaign that needed help ten days ago is finally getting attention — and the window of opportunity has already slammed shut.
This is strategy lag. It's the gap between when data is generated and when a marketer acts on it. Most teams still live in weekly CSV exports, stitched-together reports, and "let's circle back next Monday" decision-making. In that lag time, algorithms shift, audiences move on, and competitors who are monitoring in real time eat your lunch.
Real-time monitoring changes the game entirely. If your engagement rate tanks on a Tuesday afternoon, you can swap Wednesday's content before you've wasted the post. If a piece of content goes unexpectedly viral, you can boost it within the hour — not the week. If your CTR on LinkedIn is double what you're seeing on Instagram, you can reallocate creative resources before your next campaign brief is even written.
Speed of insight equals speed of response. And speed of response is a competitive advantage that compounds over time.
Most Analytics Tools Tell You What Happened. You Need One That Tells You What to Do Next.
If you're managing more than two platforms and still living in spreadsheets, you already know the pain. You're exporting CSVs from Instagram Insights, downloading reports from Twitter Analytics, toggling between LinkedIn Analytics and Facebook Business Suite, and then — somehow — trying to compare apples to oranges in a single Google Sheet that never quite formats correctly.
Posting Suite's Real-time Analytics Dashboard was built to eliminate that workflow entirely.
All four of the metrics above — engagement rate, CTR, audience growth rate, and conversion rate — are visible in a single view. No toggling. No exports. No manual cleaning. You see which platform is delivering the best CTR right now, which content format is driving engagement rate spikes this week, and where your audience growth is actually accelerating — all without opening a spreadsheet.
The dashboard isn't just a reporting tool. It's a decision-making surface. The numbers are designed to prompt action, not just observation. When a metric moves, you know what to do next because you can see the full context in real time — not five days later when the moment has passed.
If you're managing more than two platforms and still living in spreadsheets, it's time to see what your data looks like in one place.
Conclusion
Vanity metrics feel productive. They give you something to report in a Monday meeting. But reporting numbers that don't correlate to business outcomes is just organized guessing.
The four metrics outlined here — engagement rate, CTR, audience growth rate, and conversion rate from social — give you a complete picture. They tell you if your content is resonating, if your audience is growing with intention, if your funnel is functioning, and if your social efforts are actually driving revenue.
Tracking the right metrics isn't just about better reports. It's about reclaiming the hours you spend stitching together spreadsheets and using them to actually improve your strategy. It's about closing the gap between insight and action. And it's about making social media the growth engine it was always supposed to be — not just a numbers game you play to feel busy.
See Your Data in Real Time →
Stop living in spreadsheets. Start making decisions.
